My Work
Week 2
This week marked our first seminar, where we learned how to create a website. Building my first website was quite overwhelming at first, with many downloads and setups involved. Getting my website successfully linked took a considerable amount of time, but ultimately, I mastered the process, which gave me a sense of accomplishment. Writing the code wasn’t too challenging since I chose a simple template, and my previous studies helped me understand the meaning behind each part of the code. Applying the template was manageable, but figuring out how to modify the modules within it remained confusing, highlighting the need for further learning. Some elements of the template felt irrelevant to my project, but I found it difficult to adjust them.
Overall, this was a highly rewarding lesson. I was introduced to CSS and HTML for the first time, gaining a deeper understanding of the languages behind website creation. It’s fascinating to realize how the web has transformed the world and the way people access information. I’m excited to see how my website develops in the future.
Week 3
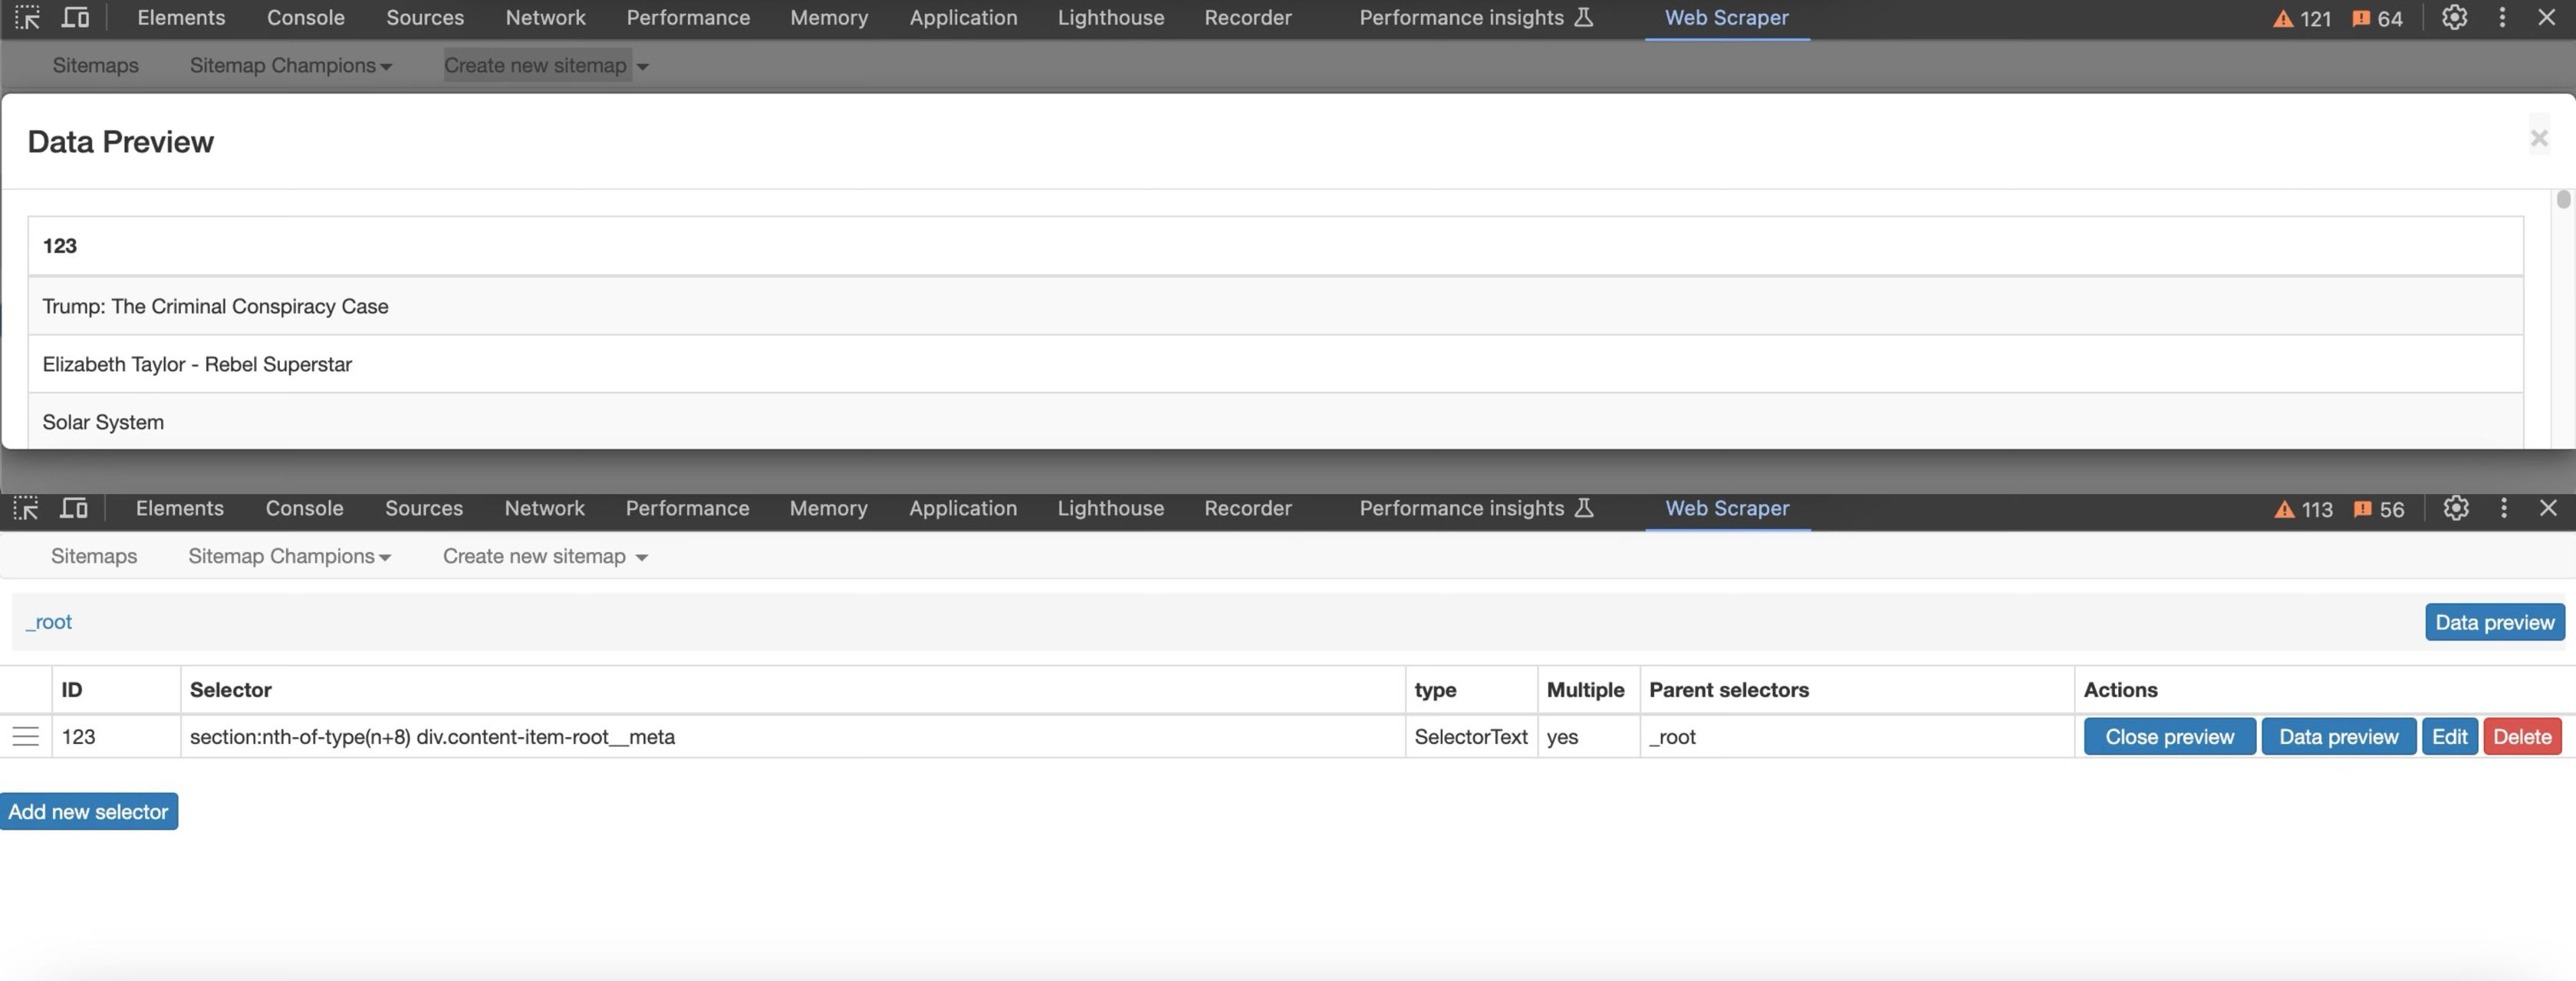
In the third week, we learned about web scraping and used webscraper.io to scrape content from the BBC website. This was my first time learning how to extract data from a website and apply it to research. However, I found that the amount of data I could collect was still quite limited, which might be due to how I designed the scraping keywords. I realized that my next step should be learning how to effectively scrape more data.
At first, web scraping seemed a bit complicated, but with the help of webscraper.io, I was able to scrape and organize data (even though I didn’t gather much). This experience gave me a clearer understanding of website structures and how to effectively target specific data. Overall, it was a very useful lesson, and I look forward to improving my scraping techniques and applying them to future projects.
Week 4
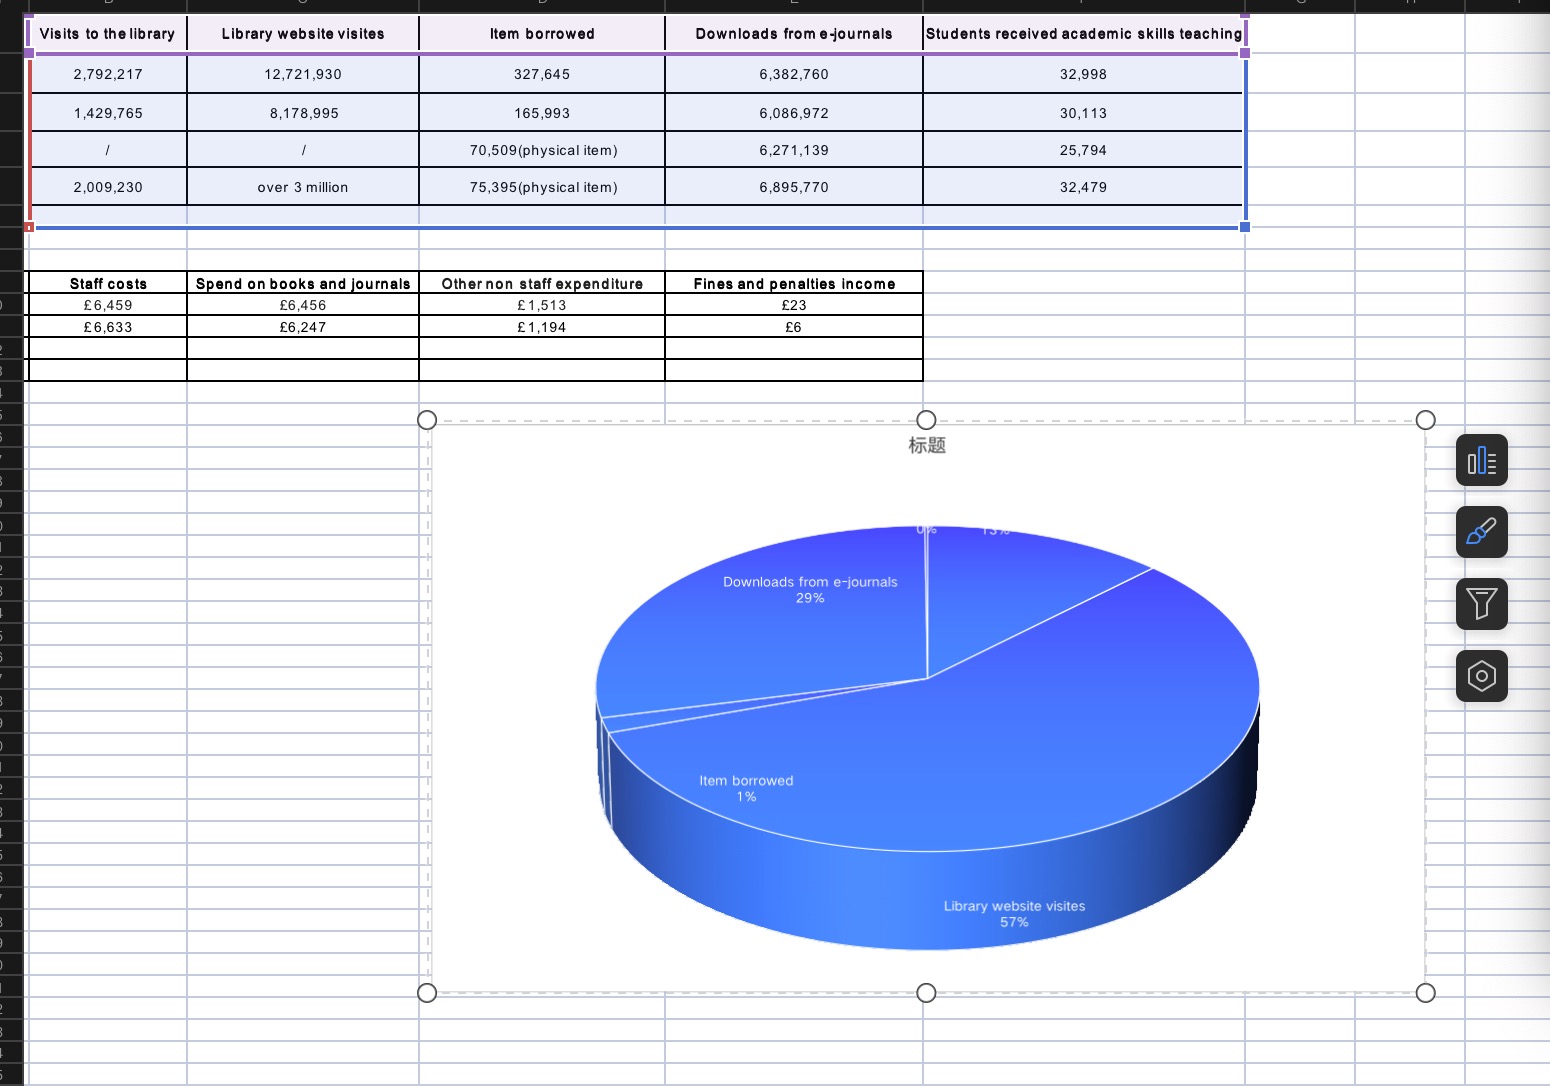
In the fourth week of our course, we focused on data collection. Our group chose the university-led data collection scenario, focusing on the resource usage and student academic activities at the University of Leeds library. We collected data from 2018 to 2023 based on reports published by the Leeds library. From these reports, we selected several key variables: visits to the library, library website visits, items borrowed (physical books), downloads from e-journals, and the number of students receiving academic skills training. We organized these data into a table to analyze the trends.
From the table, our group identified some key insights. For example, compared to physical library visits, the number of library website visits was significantly higher, indicating an increasing reliance on digital resources among students. Additionally, downloads from e-journals consistently exceeded the number of physical book loans. We also noticed a gap in data for the period from 2020 to 2021, likely due to the library's closure during the pandemic, which limited our ability to analyze trends during that time.
Through this exercise, our group recognized that publicly available data is helpful in identifying overall trends but often lacks detailed information about specific user groups or behaviors. This task deepened my understanding of the importance of data collection and the challenges it entails. It also reminded me of the need to focus on data diversity, completeness, and ethical considerations in future data analysis.
Week 5
In the fifth week of our course, we learned how to present collected data through visualization to better interpret patterns and relationships within the data. Based on the data collected in Week 4 about the University of Leeds library’s resource usage, our group used Excel to create a pie chart, visualizing the data from the table. The pie chart clearly illustrates the proportions of resource usage. For example, library website visits accounted for the largest share at 57%, followed by e-journal downloads at 29%, while physical book loans accounted for only 1%. This highlights students' strong reliance on digital resources.
When designing and creating the visualization, our primary audience was university administrators and library staff. The goal was to help them understand patterns of library resource usage and provide insights for future resource allocation and improvement. Through the intuitive chart, we aimed to make the audience aware of the importance of digital resources, encouraging them to invest more in online resources and e-journals while optimizing library services to better support students’ learning needs.
During the process, we encountered some challenges. For instance, selecting the appropriate data visualization tools and the most effective chart type to reflect the data was a key difficulty. While Excel was sufficient for creating a simple pie chart, it was limited in handling more complex variable combinations. In the future, I hope to further develop my skills in advanced visualization tools, exploring more complex data patterns to provide stronger support for research and analysis.
Week 7
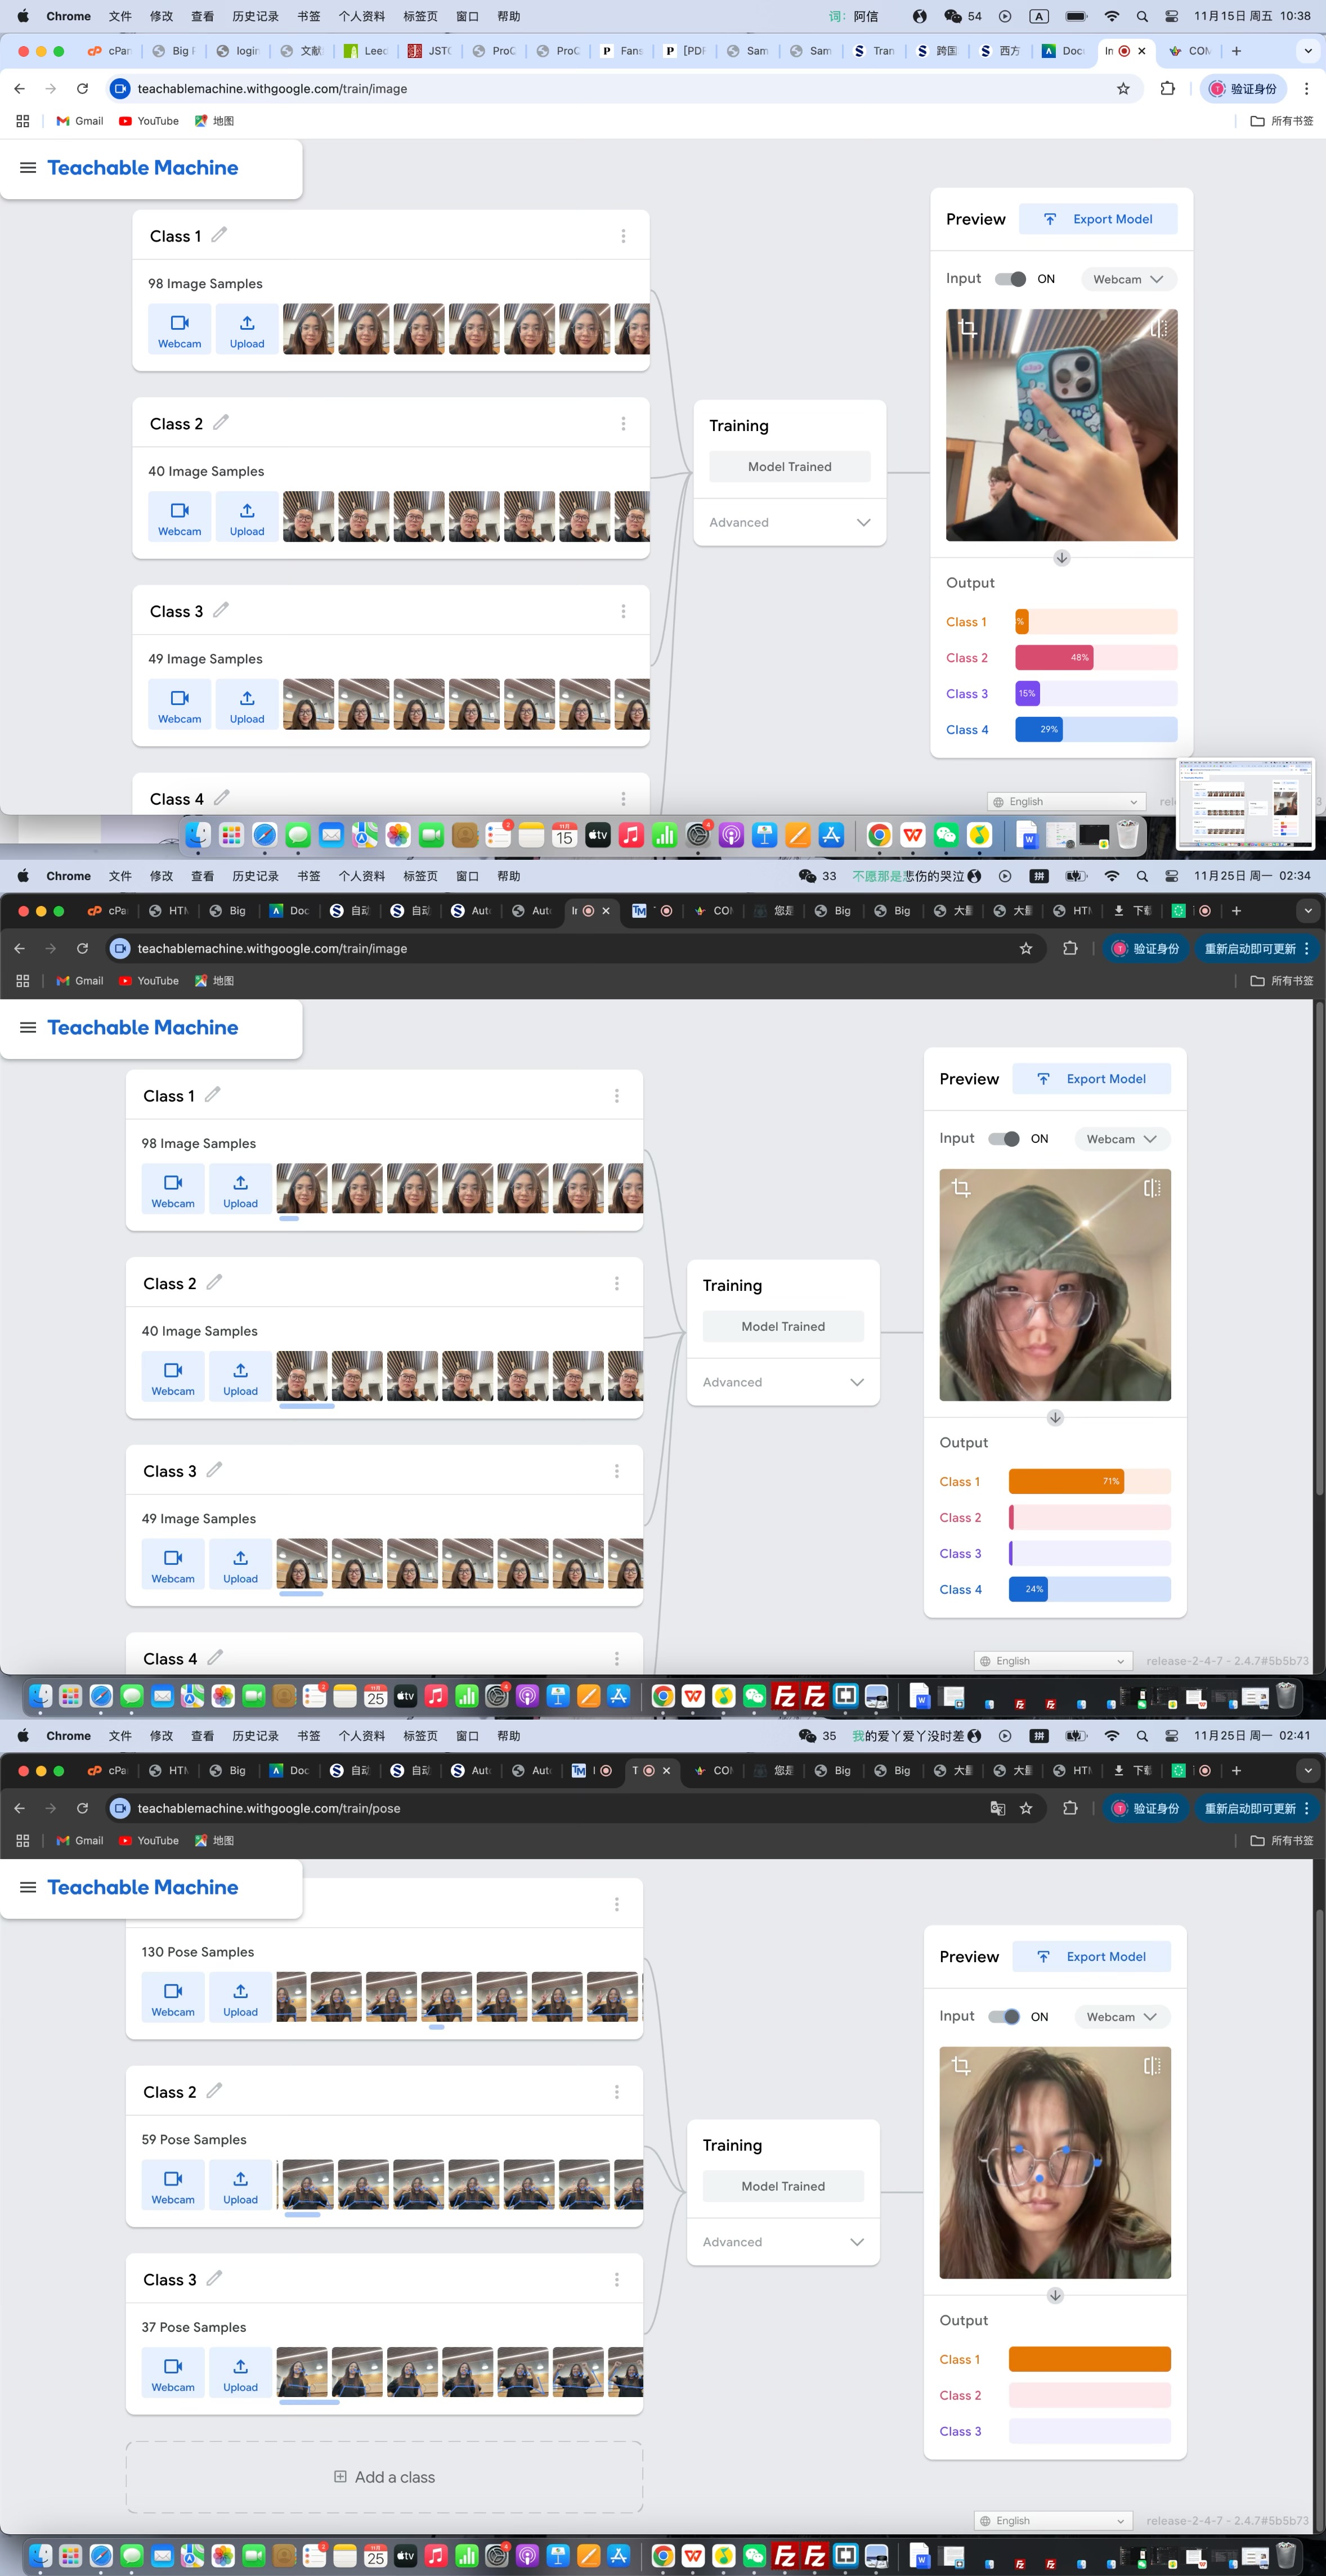
This week7, our theme was machine learning. Before the workshop, I tried Facework, which I found to be a challenging experience as I struggled to achieve the required smiles. For instance, I attempted roles such as a waiter and a hairdresser, but these attempts resulted in relatively low rewards. Interestingly, I had previously worked part-time as a waiter and received tips, which made me realize the limitations of facial recognition technologies. These systems often rely on occupational stereotypes, such as musicians wearing bow ties, professors frowning, waiters displaying toothy smiles, and delivery drivers avoiding toothy smiles.As highlighted in Scheuerman et al. (2021), "automated facial recognition and its reliance on biased datasets and binary classification exacerbate systemic inequalities and perpetuate colonial legacies. These technologies require critical scrutiny because they not only reflect existing societal biases but actively reproduce and amplify them"。 Projects like Facework remind us of the need to challenge these technologies and advocate for systems that respect and affirm the diversity of human identities (Scheuerman et al., 2021).
In the workshop, our group experimented with Teachable Machine. During this process, I noticed that while training and testing models were straightforward, the results often reflected data limitations and inherent biases. For example, in the image project, I uploaded photos of four group members for the model to learn. However, I found that it frequently produced errors. For instance, when I wore a hat, the system showed a 20% probability that I belonged to Model 4 (even though I was Model 1). Similarly, when I covered my face with my hair or blocked it with a phone, the system often indicated a higher probability of me being Model 2. In the pose project, I uploaded three poses: a heart shape with hands, a "V" hand gesture, and a thumbs-up gesture. However, I noticed that even when I only showed my head without any pose, the system still identified me as performing Pose 1. The system primarily detects points and lines in the image and compares them to those in the uploaded models. As a result, this process led to frequent errors and biases.
This practice helped me deeply understand that machine learning technologies are not neutral tools; they reflect the biases and societal norms of their developers. These technologies rely heavily on user data, which raises potential privacy concerns. At the same time, the diversity and fairness of data directly affect the inclusiveness of the models. In future research, I aim to focus on data representation, design fairer models, and maintain a critical perspective on privacy protection and ethical concerns to prevent these technologies from exacerbating inequalities
Week 8
In the eighth week of the course, we focused on how algorithms shape online identities and how this process impacts our data and social interactions. During the class, I explored Facebook’s Privacy Center page and found that Facebook is likely interested in user data such as search history, browsing records, click behavior, and social interactions. The platform can see behavioral data from user activities, such as likes, comments, shares, posted content, time spent on pages, and location data. However, it cannot see the reasons behind a user's actions, such as why they liked a post or whether the like was accidental. As a result, the platform categorizes user behavior based on these actions to recommend content and deliver personalized ads. However, I also noticed the limitations of algorithms, which can introduce bias due to the limited scope of the data collected. This may lead to stereotyping users, affecting both content recommendations and user experiences, and potentially threatening user privacy due to extensive data collection.
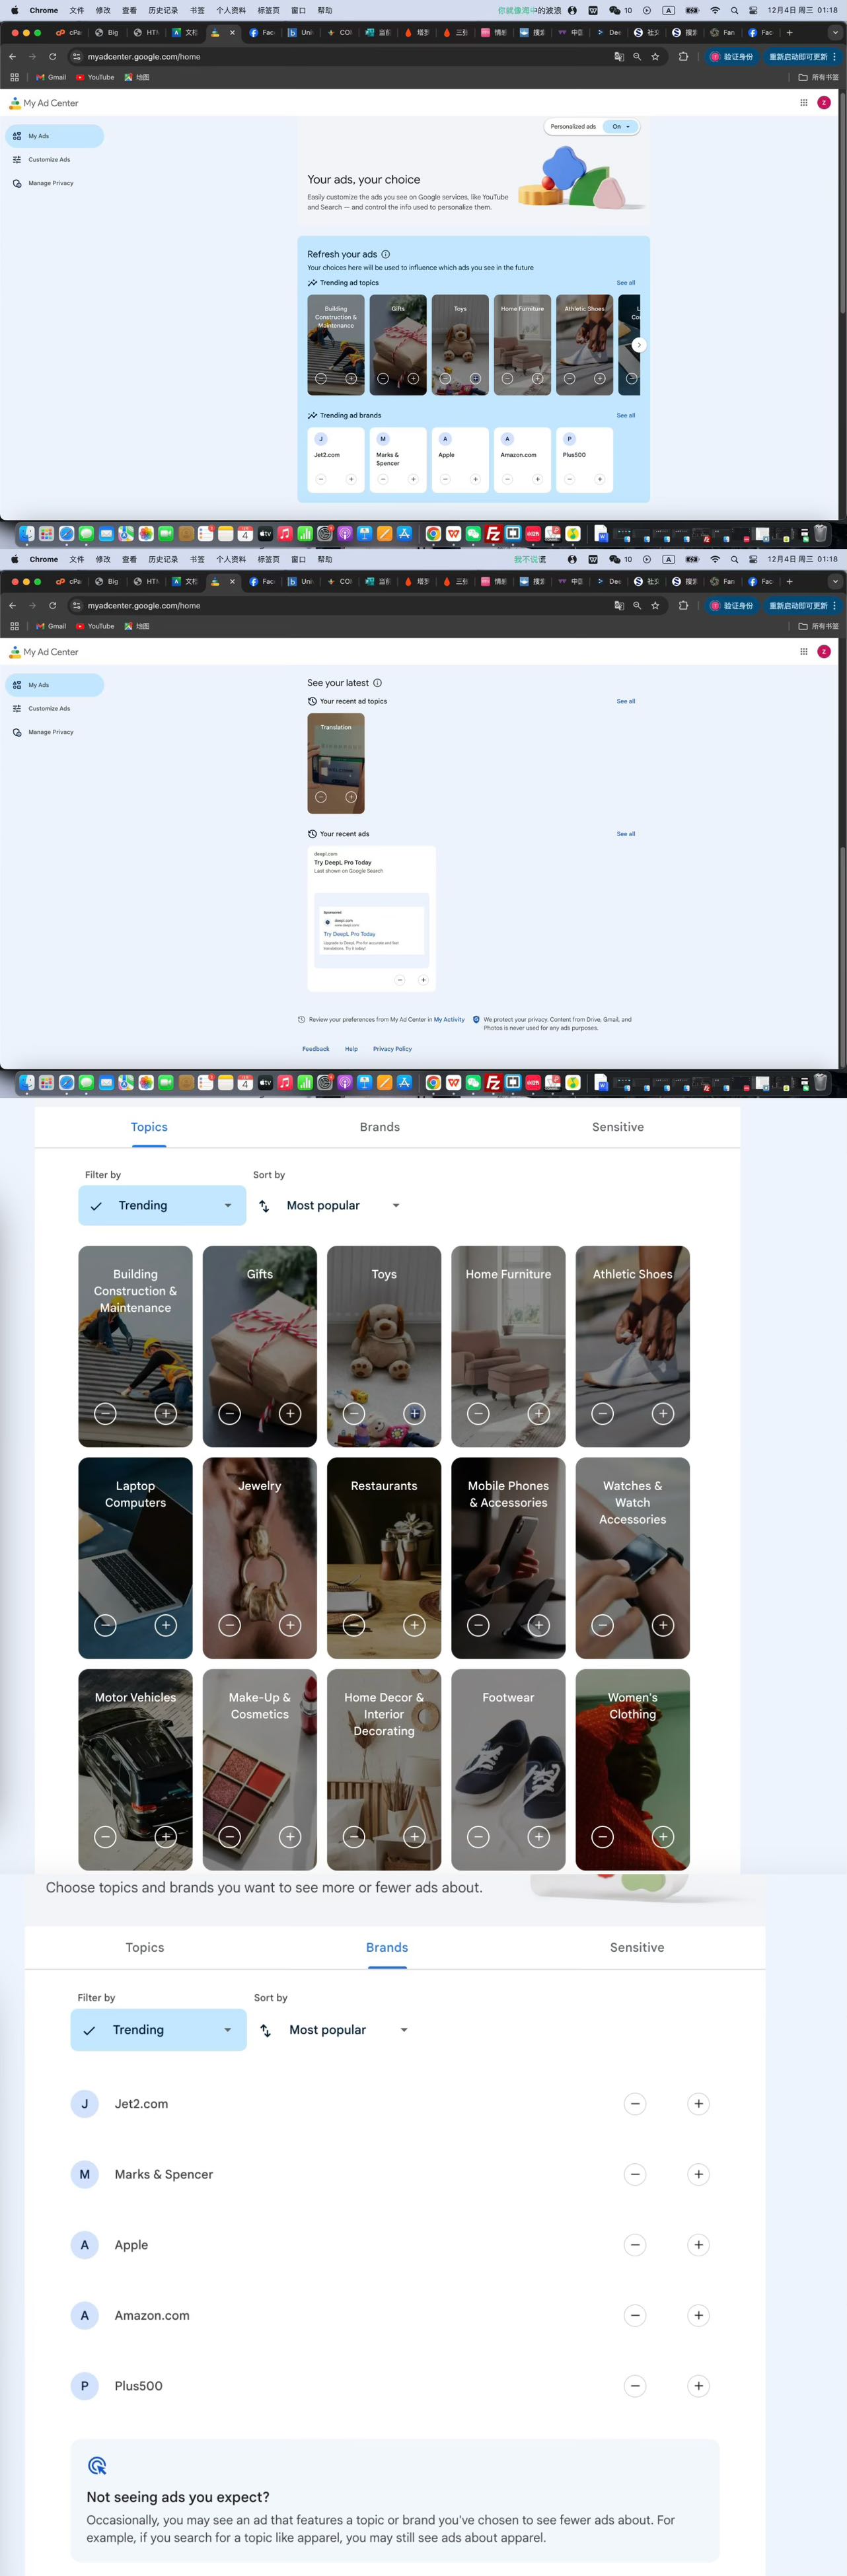
In Task 2 of the course, I examined Google’s Ad Center. Google categorizes users based on their online behavior into various topics and brands. For example, ad topics include gifts, toys, home furniture, athletic shoes, and more specific sensitive categories like alcohol, gambling, and pregnancy. The brand categories, such as "Jet2.com," "Marks & Spencer," and "Apple," are likely based on my previous searches. Interestingly, I was recommended a DeepL translation ad, probably because I frequently use this translation tool. However, the ad for Jet2.com surprised me, as I only searched for it once and never booked flights on the site. This made me question how certain ads are prioritized in my profile.
I think the platform’s attempt to understand users through algorithmic classification and personalized ads has some value in optimizing the user experience, as it provides more targeted content. However, if I wanted to change the output, I would consider turning off personalized ad features and reducing my likes and comments on the internet to limit the amount of data these platforms can collect about me.
Week 9
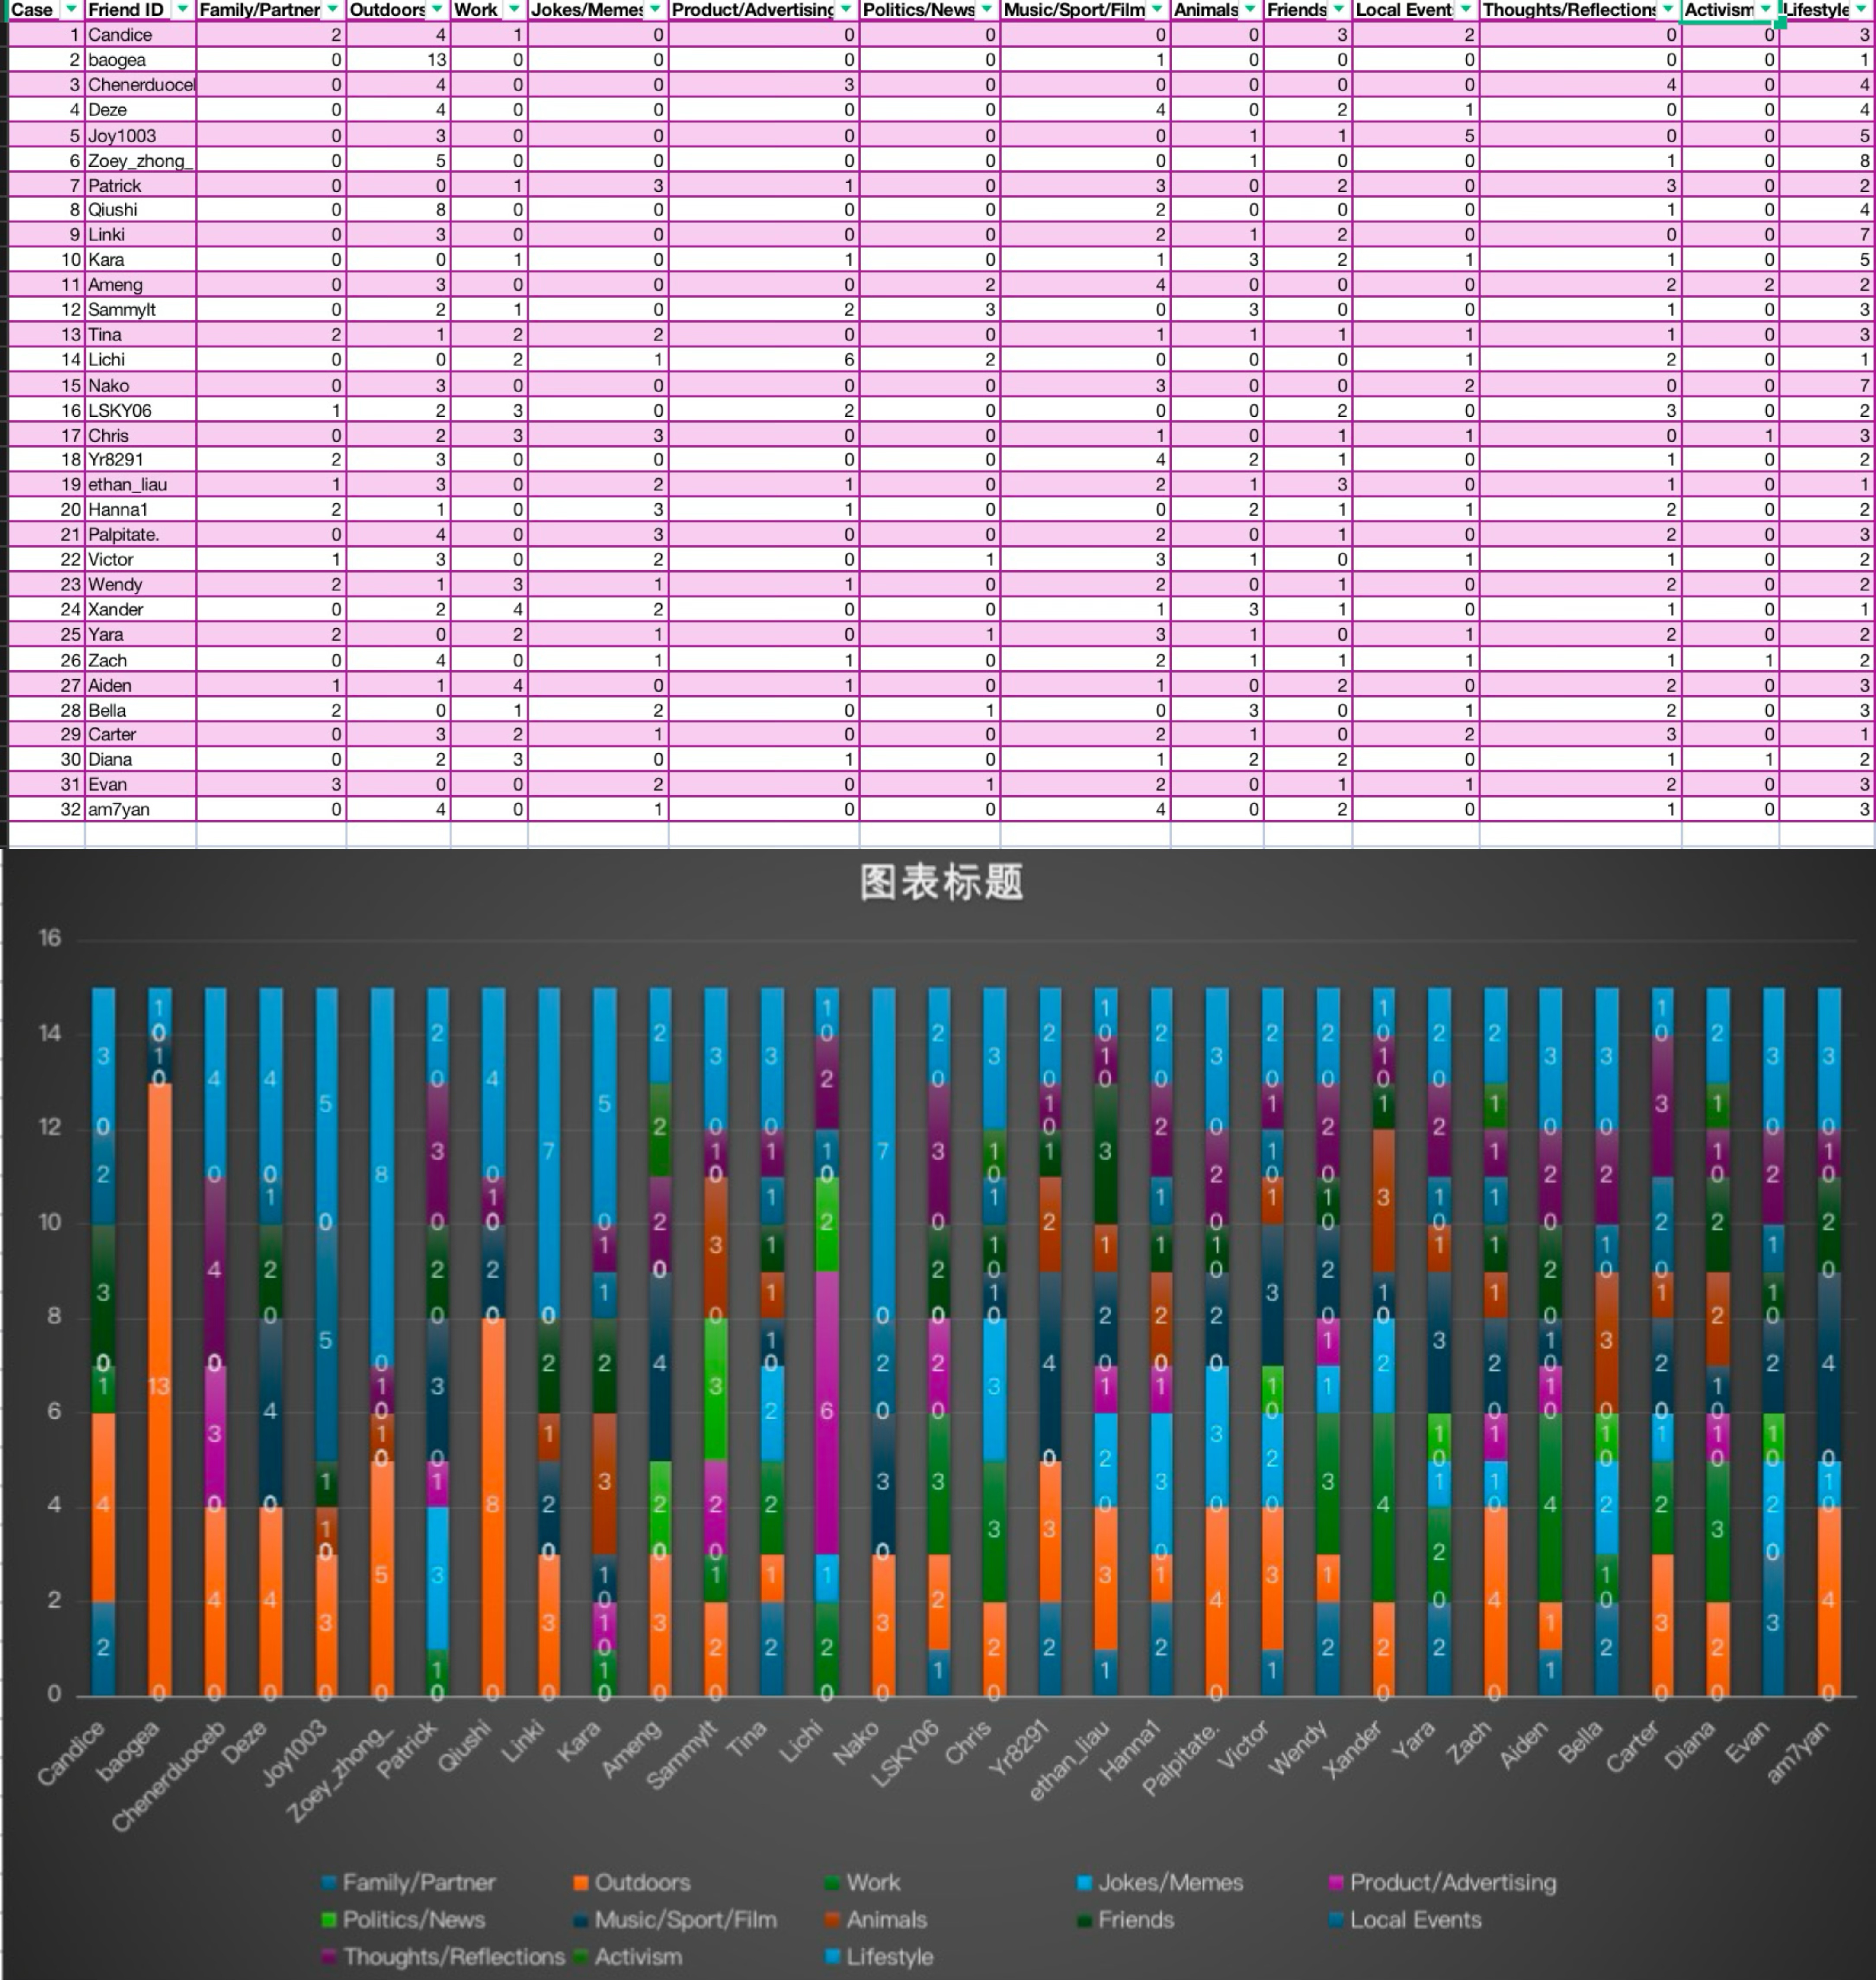
In the ninth week's workshop, we conducted group discussions by practicing Sumpter's method. Our group recorded the social media content of 32 friends and categorized it using Sumpter's framework. During this process, we found that many posts were difficult to categorize clearly, which revealed the limitations of this method. For example, some friends posted photos of gatherings that included outdoor scenes, family, and friends, making it challenging to classify them strictly into categories like “outdoors,” “friends,” or “family.” Additionally, we noticed an interesting phenomenon: the content shared by our friends often focused more on their personal lives and interests, with fewer posts about their family or friends. Surprisingly, posts related to animals appeared more frequently than those about friends or family. These findings led us to reflect on the content preferences on social media and highlighted the need for further refinement and segmentation of Sumpter's framework.
Apart from using Sumpter's method, I would prefer to conduct interviews. By directly communicating with my friends, I could ask about their perceptions of their online identities and compare those to the impressions I formed based on their shared content. This approach would provide a better understanding of how they view their social media presence and whether they consciously construct certain personas online.During the workshop, I also explored a Weibo community focused on fans of Dilraba Dilmurat, a famous Chinese actress. Fans in this digital space expressed their love and support by sharing her beautiful photos, daily updates, and works in film and television. They also used specific symbols and language to enhance mutual recognition and belonging—for instance, the number “88” symbolized Dilraba, and “28” represented admiration for her. Through observation, I realized that digital communities are highly dynamic, with member behaviors and interactions fluctuating according to trending events. For example, whenever Dilraba posts updates, the community becomes particularly active.
In the future, I would like to study how people construct their online personas. During the research, I noticed that my friends' online identities often differ from how I perceive them offline, and I am deeply interested in exploring the reasons behind this discrepancy.
Week 10
In week 10 of the course we experienced the game Space Frog in class and created it using Twine. These tasks, combined with the readings before and after class, provided me with a variety of interactive experiences and allowed me to understand some of the characteristics of interactive narratives more intuitively. The three main Twine games I experienced were ‘Frogs in Space’, an individual Twine creation game, and a group Twine creation game.
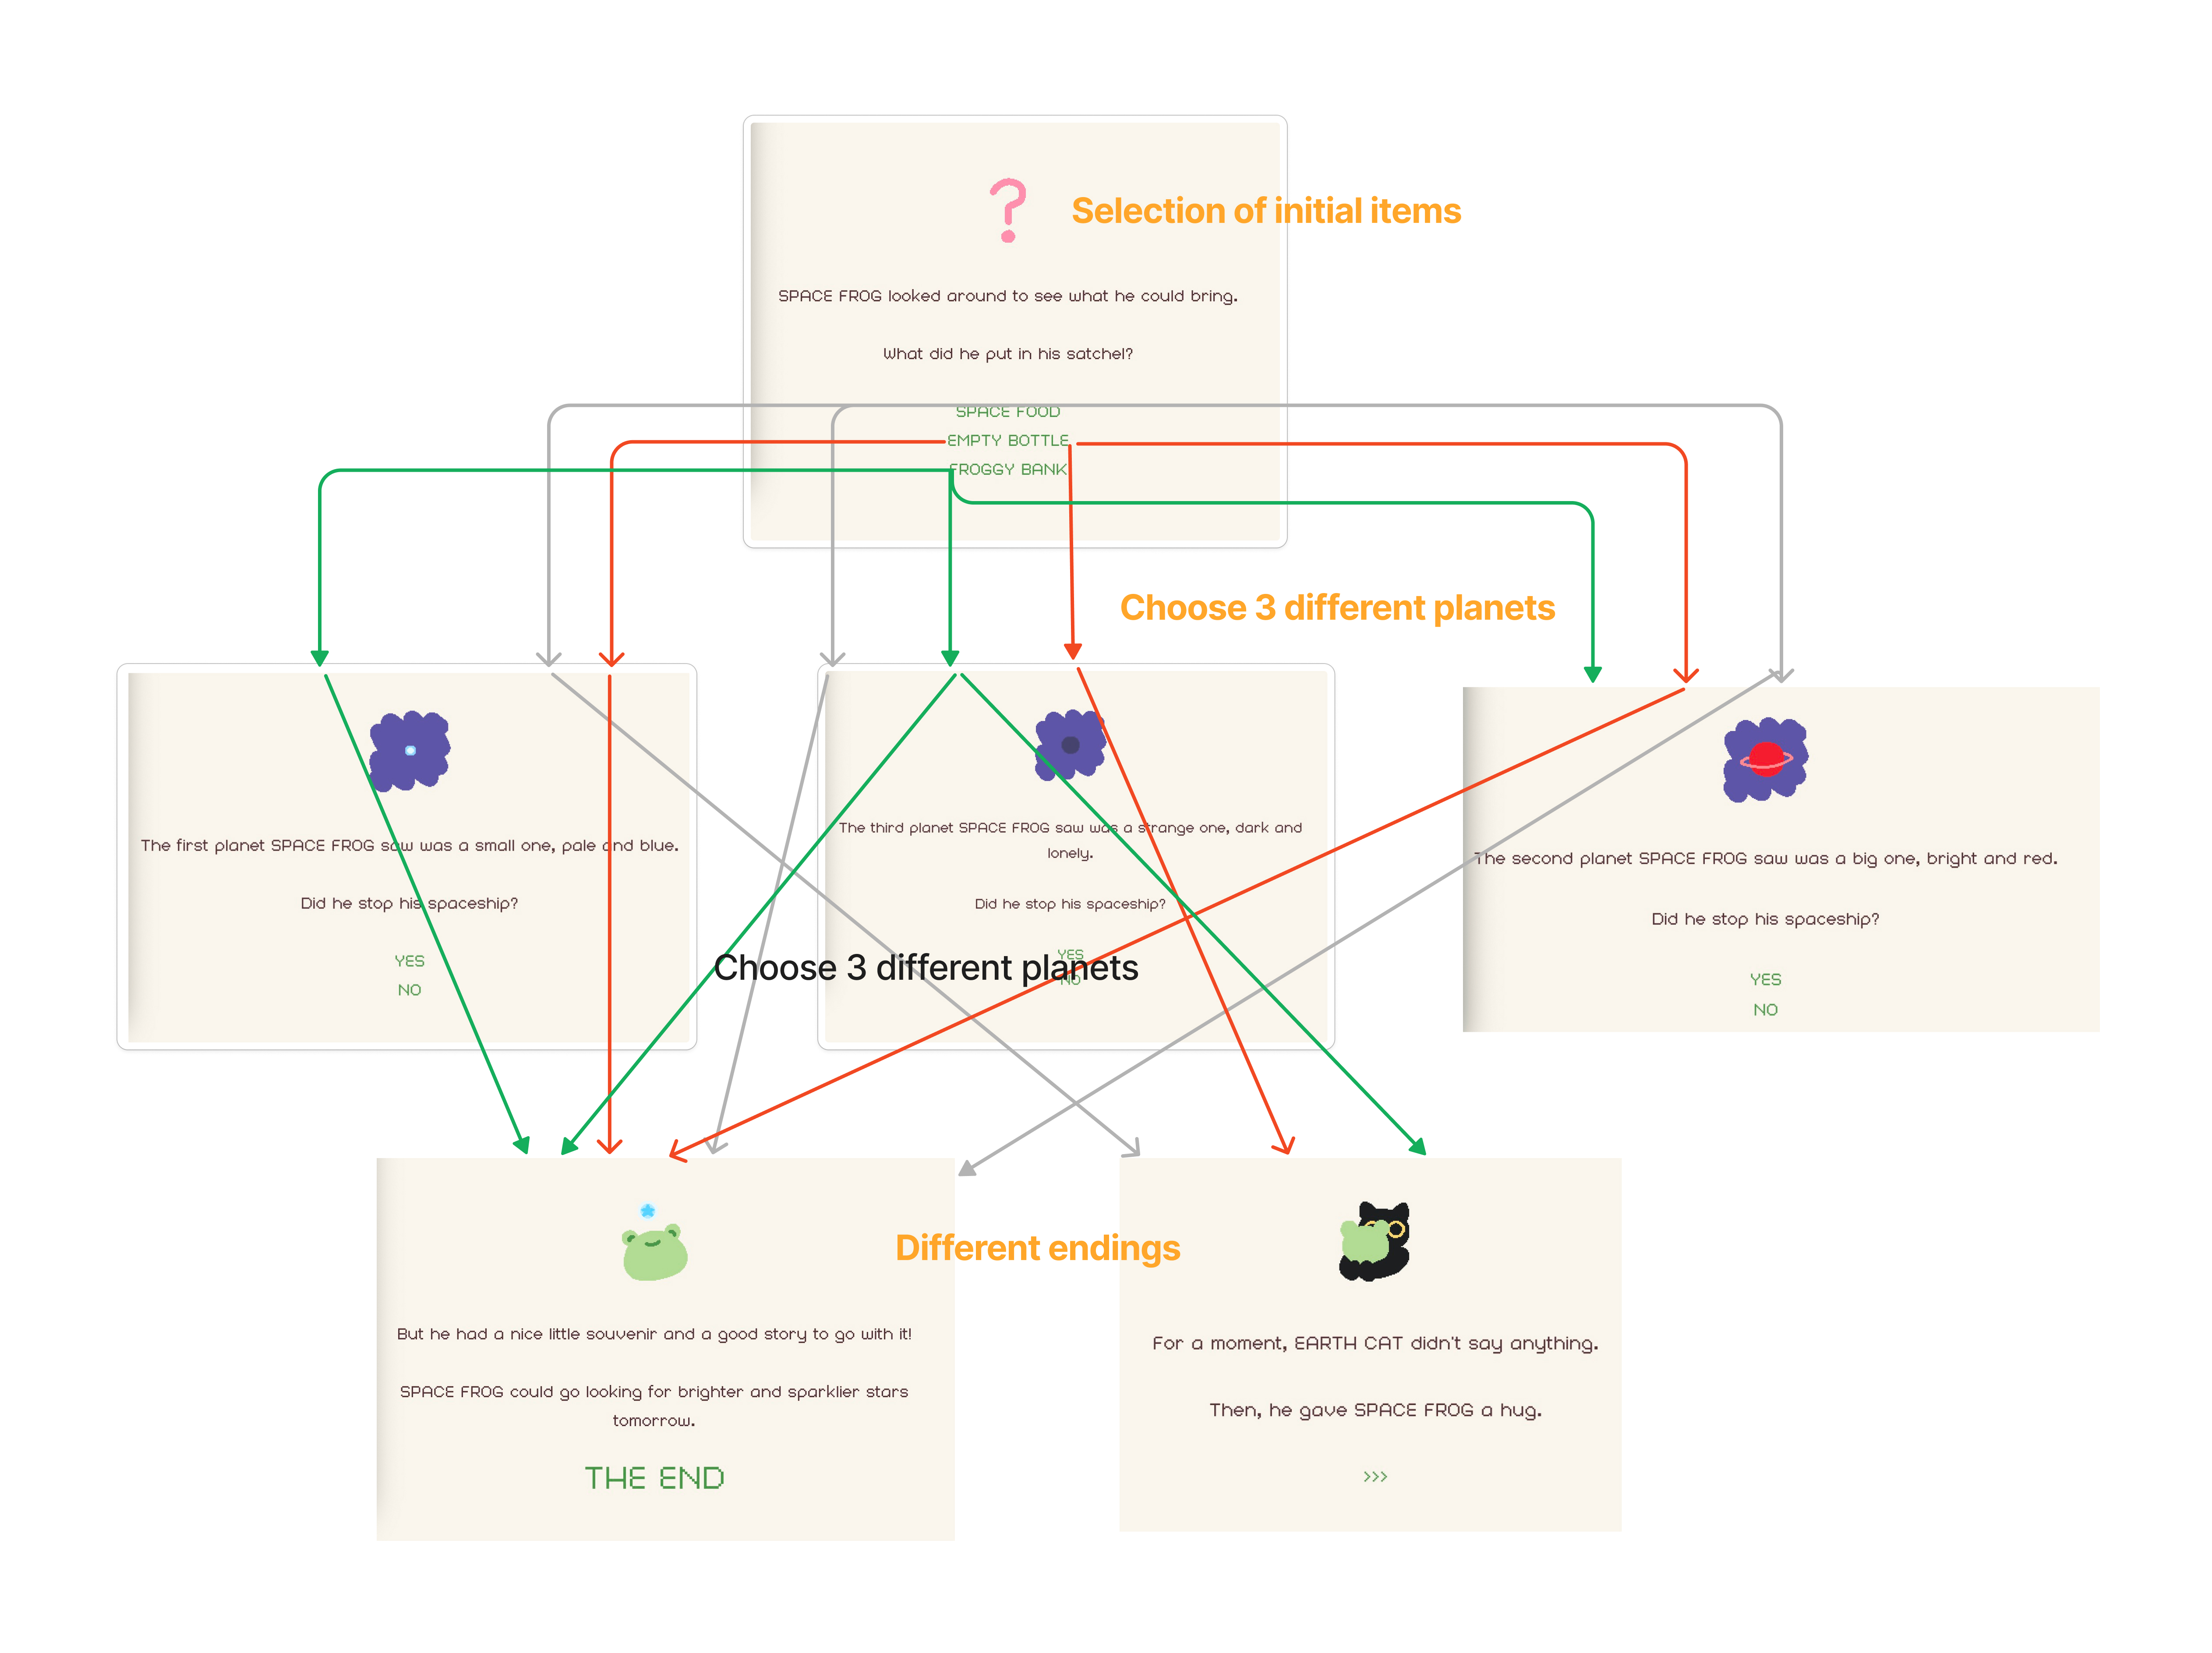
Space Frog is an interactive game in which your decisions shape the story. Players must select basic things (such as empty bottles or space food) and explore worlds of various colors (blue, red, or black). The game has a number of alternative endings, including obtaining enormous shiny stars, just getting small stars, or even returning empty-handed. This design made me realize the importance of choice in narrative and demonstrated the flexibility of branching paths; Aarseth's theory of 'cybertext' states that the core of interactive narratives is the user's choice to shape the dynamic text, whereas 'ergodic literature' refers to the user's choice to shape the dynamic text. Literature highlights the importance of users making an effort to understand and explore the story. In Frogs in Space, players try out numerous combinations of objects and planets to find the best path, a trial-and-error process that not only adds to the fun of exploration, but also boosts the player's sense of initiative and participation in the story. 'Frogs in Space' also makes me think of Borges' concept of the "garden of divergent paths," in which time is not linear but full of branching possibilities. The game's multi-path narrative allows the player to sense the unlimited possibilities of choice and create a unique storytelling experience by branching off into multiple routes.
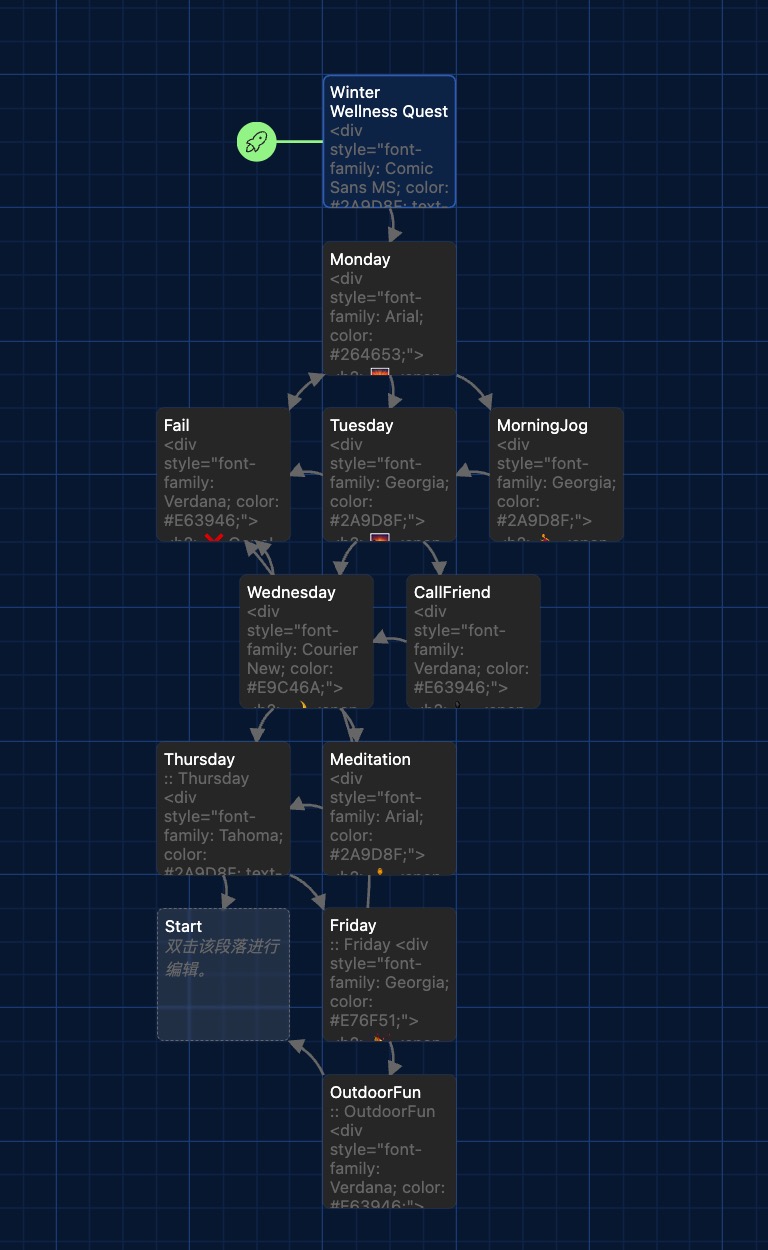
Winter Wellness Quest is a class project I created to help international students cope with the winter blues. Every day, players must make important decisions, such as whether or not to go for a morning run, how to plan the rest of the afternoon, and how to end the day in the evening. These decisions provide various plot feedbacks, which gradually affect the player's mood and routine for the week. Despite the simplicity of the design, it helps the player understand the impact of everyday routines on mood and health, particularly the need of getting to bed early for winter health.
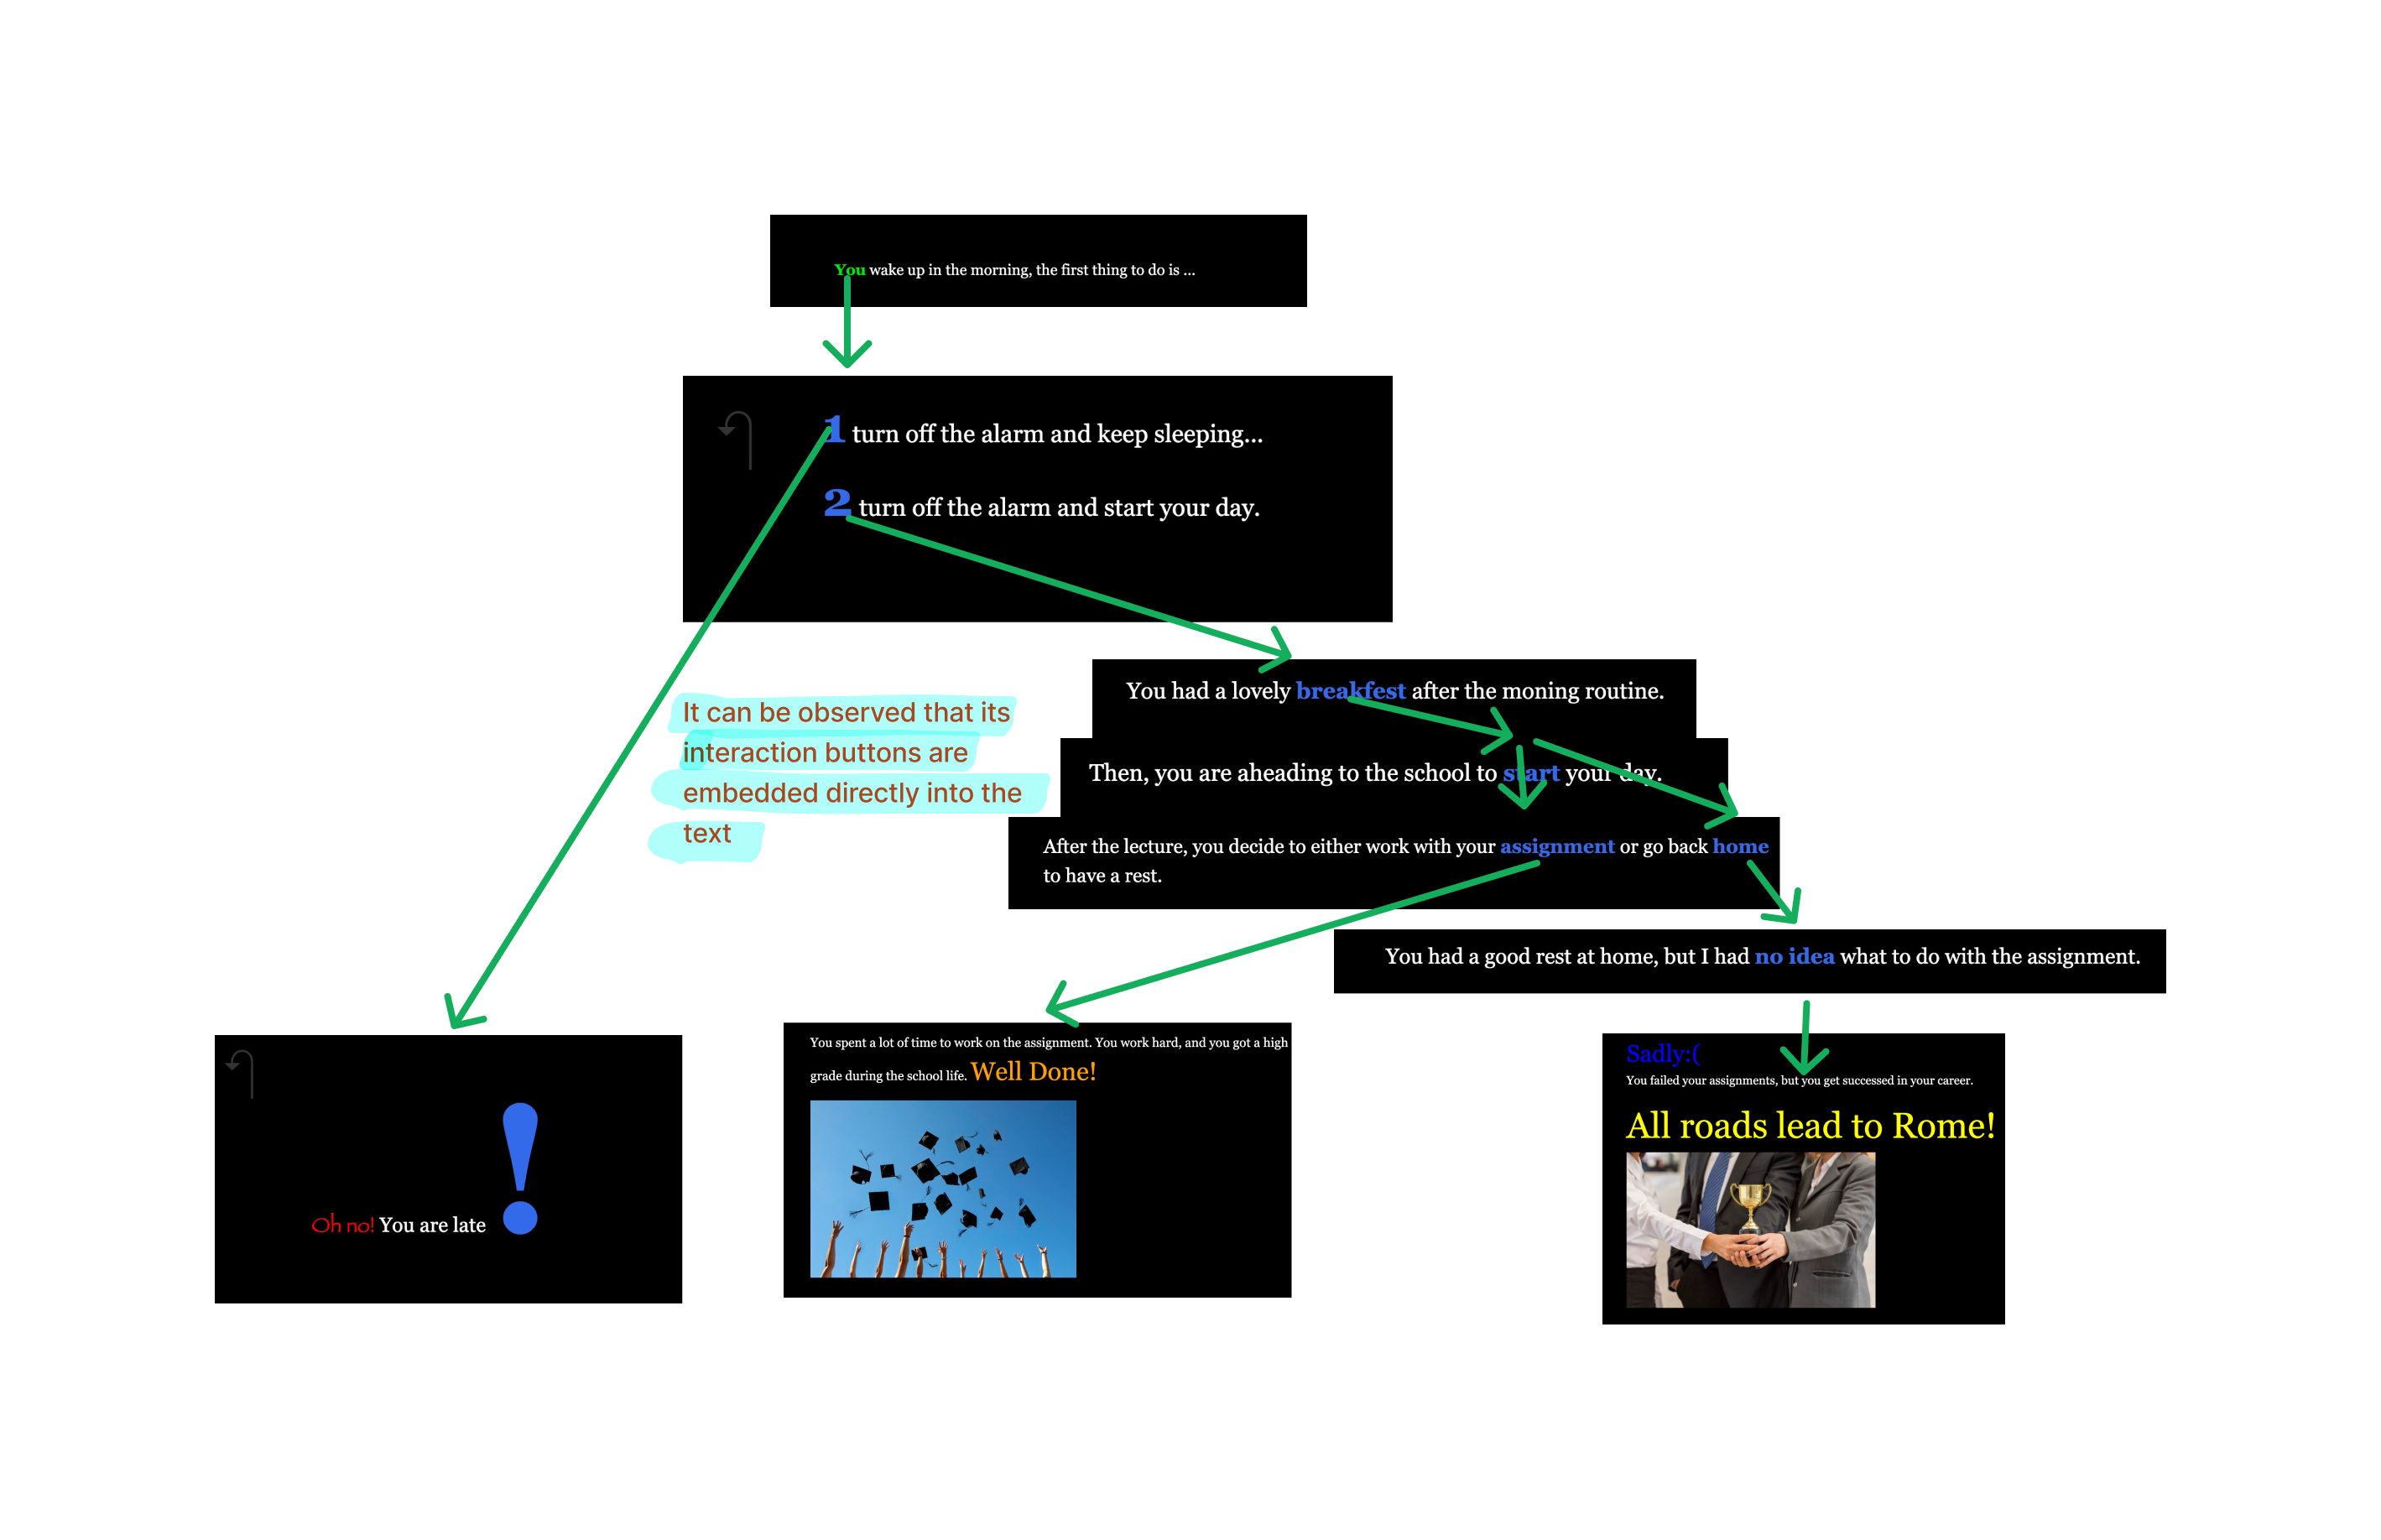
A group member utilized Twine to create a game based on college students' daily study tasks. For example, in the game, players can graduate by rigorously completing their duties, whereas a lax approach can lead to failure. The nicest design feature of the game, in my opinion, is that she included clickable buttons in the text, which I believe improves the player's immersion while reading.〈br/>
I believe that the novelty of interactive tales is that they can elicit emotional resonance in players through choices. For example, Frogs in Space engages the player through a warm narrative environment, and the story of a frog hunting for stars for an Earth cat might resonate with the player's friendship; whereas Winter Wellness Quest resonates with the player's lived experience through its The 'Winter Wellness Quest' speaks to the player's life experience by telling a true narrative about the chaotic routines of students in the United Kingdom during the winter. Through these quests, I've realized that interactive narratives are more than just a form of entertainment; they're also a strong medium for eliciting thought and emotional resonance in players. In the future, interactive narrative design may have a greater impact on education, cultural expression, and the examination of societal concerns.
哈哈哈哈哈哈